

A random sample of 21 AP Statistics teachers was asked to report the age (in years) and
Question:
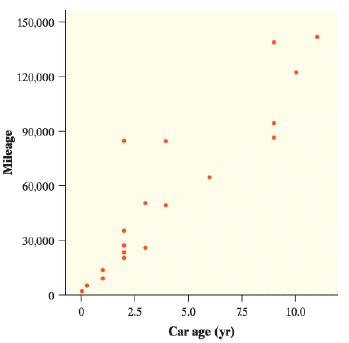
A random sample of 21 AP® Statistics teachers was asked to report the age (in years) and mileage of their primary vehicles. Here is a scatterplot of the data:
Here is some computer output from a least-squares regression analysis of these data. Assume that the conditions for regression inference are met.

a. Verify that the 95% confidence interval for the slope of the population regression line is (9016.4, 14,244.8).
b. A national automotive group claims that the typical driver puts 15,000 miles per year on his or her main vehicle. We want to test whether AP® Statistics teachers are typical drivers. Explain why an appropriate pair of hypotheses for this test is H0:β1 = 15,000 versus Ha:β1 ≠ 15,000.
c. Compute the standardized test statistic and P -value for the test in part (b). What conclusion would you draw at the α = 0.05 significance level?
d. Does the confidence interval in part (a) lead to the same conclusion as the test in part (c)? Explain your answer.
Step by Step Answer:
Solution a Null and alternative hypothesis Ho 0 Ha 0 Test statistic t 817 pval...View the full answer


