

Question: Exercise 75 in Chapter 10 (page 686) compared two methods for estimating tire wear. The first method used the amount of weight lost by a
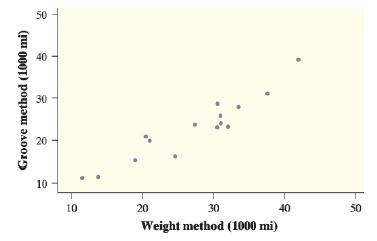
Exercise 75 in Chapter 10 (page 686) compared two methods for estimating tire wear. The first method used the amount of weight lost by a tire. The second method used the amount of wear in the grooves of the tire. A random sample of 16 tires was obtained. Both methods were used to estimate the total distance traveled by each tire. The following scatterplot displays the two estimates (in thousands of miles) for each tire.
Here is some computer output from a least-squares regression analysis of these data. Assume that the conditions for regression inference are met.
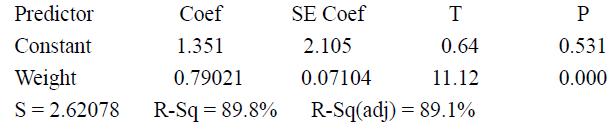
a. Verify that the 99% confidence interval for the slope of the population regression line is (0.5787, 1.0017).
b. Researchers want to test whether there is a difference in the two methods of estimating tire wear. Explain why the researchers might want to test the hypotheses H0:β1=1 versus Ha:β1 ≠ 1.
c. Compute the standardized test statistic and P -value for the test in part (b). What conclusion would you draw at the α = 0.01 significance level?
d. Does the confidence interval in part (a) lead to the same conclusion as the test in part (c)? Explain your answer.
Exercise 75.
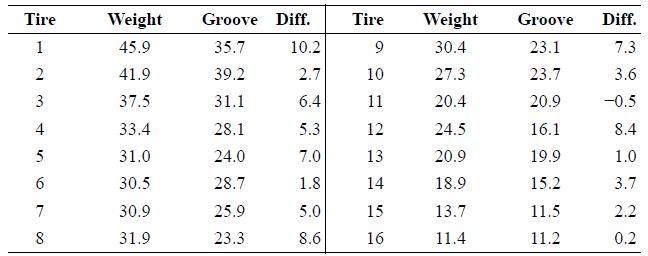
Researchers were interested in comparing two methods for estimating tire wear. The first method used the amount of weight lost by a tire. The second method used the amount of wear in the grooves of the tire. A random sample of 16 tires was obtained. Both methods were used to estimate the total distance traveled by each tire. The table provides the two estimates (in thousands of miles) for each tire.
50 40 30 20 10 10 20 30 40 50 Weight method (1000 mi) Groove method (1000 mi)
Step by Step Solution
3.48 Rating (171 Votes )
There are 3 Steps involved in it
The second method used the amount of wear in the grooves of the tire A random sample of 16 tires was ... View full answer

Get step-by-step solutions from verified subject matter experts