

Question: Ecologists look at data to learn about natures patterns. One pattern they have identified relates the size of a carnivore (body mass in kilograms) to
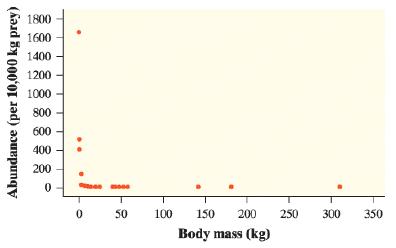
Ecologists look at data to learn about nature’s patterns. One pattern they have identified relates the size of a carnivore (body mass in kilograms) to how many of those carnivores exist in an area. A good measure of “how many” is to count carnivores per 10,000 kg of their prey in the area. The scatterplot shows this relationship between body mass and abundance for 25 carnivore species.
The following graphs show the results of two different transformations of the data. The first graph plots the logarithm (base 10) of abundance against body mass. The second graph plots the logarithm (base 10) of abundance against the logarithm (base 10) of body mass.
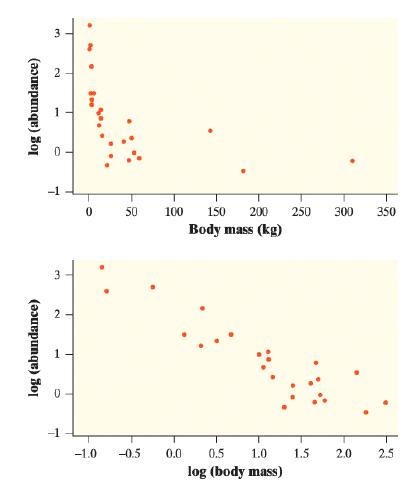
a. Based on the scatterplots, would an exponential model or a power model provide a better description of the relationship between abundance and body mass? Justify your answer.
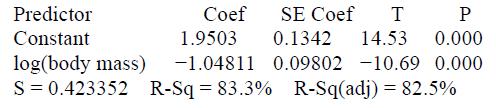
b. Here is computer output from a linear regression analysis of log(abundance) and log(body mass). Give the equation of the least-squares regression line. Be sure to define any variables you use.
c. Use your model from part (b) to predict the abundance of black bears, which have a body mass of 92.5 kg.
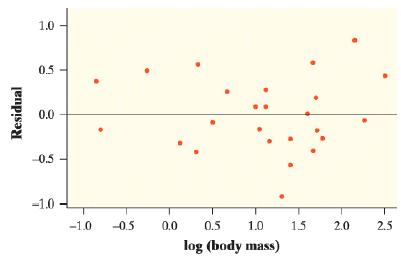
d. Here is a residual plot for the linear regression in part (b). Do you expect your prediction in part (c) to be too large, too small, or about right? Justify your answer.
1800 1600 1400 1200 1000 800 600 400 200 50 100 150 200 250 300 350 Body mass (kg) Abundance (per 10,000 kg prey)
Step by Step Solution
3.50 Rating (177 Votes )
There are 3 Steps involved in it
Answer a Among the four models Rsq and Adj Rsq is lowest for the linear m... View full answer

Get step-by-step solutions from verified subject matter experts