

How well do professional golfers putt from various distances to the hole? The scatterplot shows various distances
Question:
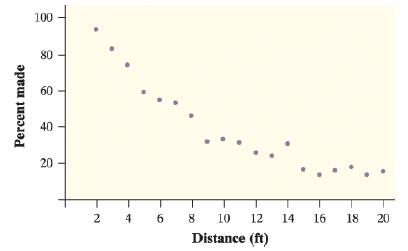
How well do professional golfers putt from various distances to the hole? The scatterplot shows various distances to the hole (in feet) and the percent of putts made at each distance for a sample of golfers.
The graphs show the results of two different transformations of the data. The first graph plots the natural logarithm of percent made against distance. The second graph plots the natural logarithm of percent made against the natural logarithm of distance.
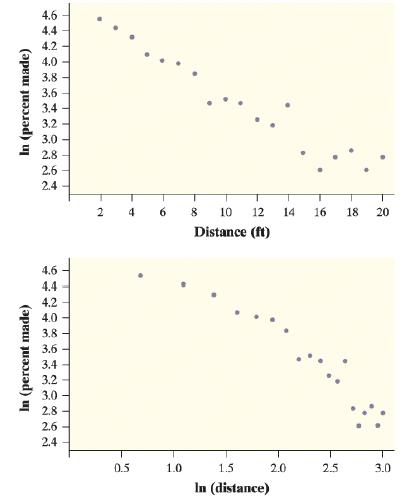
a. Based on the scatterplots, would an exponential model or a power model provide a better description of the relationship between distance and percent made? Justify your answer.
b. Here is computer output from a linear regression analysis of ln(percent made) and distance. Give the equation of the leastsquares regression line. Be sure to define any variables you use.
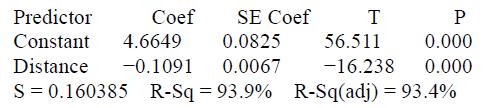
c. Use your model from part (b) to predict the percent made for putts of 21 feet.
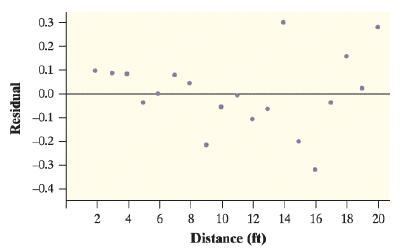
d. Here is a residual plot for the linear regression in part (b). Do you expect your prediction in part (c) to be too large, too small, or about right? Justify your answer.
Step by Step Answer:
a If we look at both scatterplots we see that we find an additional linear relationship to t...View the full answer


