

Refer to Exercise 23. a. Find the distribution of responses about whether there was broken glass at
Question:
Refer to Exercise 23.
a. Find the distribution of responses about whether there was broken glass at the accident for each of the three treatment groups. Make a segmented bar graph to compare these distributions.
b. Describe what the graph in part (a) reveals about the association between response about broken glass at the accident and treatment received for the subjects in the study.
Exercise 23.
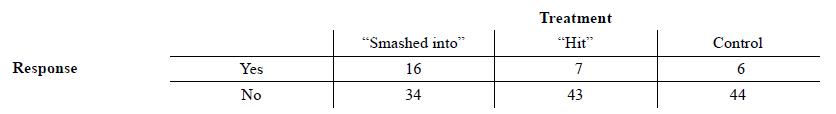
Researchers asked 150 subjects to recall the details of a car accident they watched on video. Fifty subjects were randomly assigned to be asked, “About how fast were the cars going when they smashed into each other?” For another 50 randomly assigned subjects, the words “smashed into” were replaced with “hit.” The remaining 50 subjects the control group—were not asked to estimate speed. A week later, all subjects were asked if they saw any broken glass at the accident (there wasn’t any). The table shows each group’s response to the broken glass question.
Step by Step Answer:
ANSWER a The distribution of responses about whether there was bro...View the full answer


