

Question: Refer to Exercise 76. Construct and interpret a 95% confidence interval for the true mean difference (Bottom Top) in the zinc concentrations of the
Refer to Exercise 76. Construct and interpret a 95% confidence interval for the true mean difference (Bottom – Top) in the zinc concentrations of the wells in this region.
Exercise 76.
Trace metals found in wells affect the taste of drinking water, and high concentrations can pose a health risk. Researchers measured the concentration of zinc (in milligrams/liter) near the top and the bottom of 10 randomly selected wells in a large region. The data are provided in the following table.
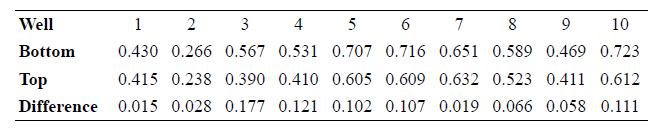
Well 1 2 3 5 6 7 8 10 Bottom 0.430 0.266 0.567 0.531 0.707 0.716 0.651 0.589 0.469 0.723 p 0.415 0.238 0.390 0.410 0.605 0.609 0.632 0.523 0.411 0.612 Difference 0.015 0.028 0.177 0.121 0.102 0.107 0.019 0.066 0.058 0.111
Step by Step Solution
3.50 Rating (170 Votes )
There are 3 Steps involved in it
To construct a confidence interval for the true mean difference in zinc concentrations we will use t... View full answer

Get step-by-step solutions from verified subject matter experts