

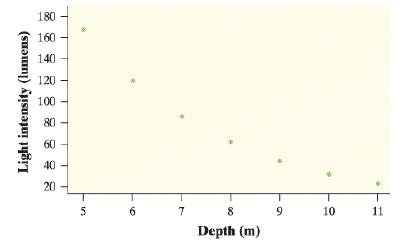
Some college students collected data on the intensity of light at various depths in a lake. Here
Question:
Some college students collected data on the intensity of light at various depths in a lake. Here is a scatterplot of their data:
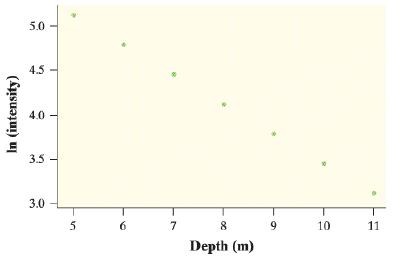
a. At top right is a scatterplot of the natural logarithm of light intensity versus depth. Based on this graph, explain why it would be reasonable to use an exponential model to describe the relationship between light intensity and depth.
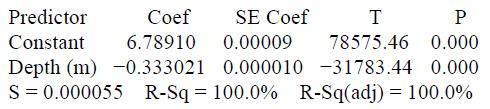
b. Here is computer output from a linear regression analysis of the transformed data. Give the equation of the least-squares regression line. Be sure to define any variables you use.
c. Use your model to predict the light intensity at a depth of 12 meters.
Fantastic news! We've Found the answer you've been seeking!
Step by Step Answer:
a At top right is a scatterplot of the natural logarithm of light intensity versus ...View the full answer

Answered By
Nazish Bibi
I have MPhil in statistics from quaid-i-Azam university. I am expert in statistics, probability linear algebra and calculus. I can help you related to these topics. I am working as an online tutor for many years.
0 Reviews
10+ Question Solved
Related Book For 

Question Posted:
