

Question: Students in a high school statistics class were given data about the main method of transportation to school for a group of 30 students. They
Students in a high school statistics class were given data about the main method of transportation to school for a group of 30 students. They produced the pictograph shown. Explain how this graph is misleading.
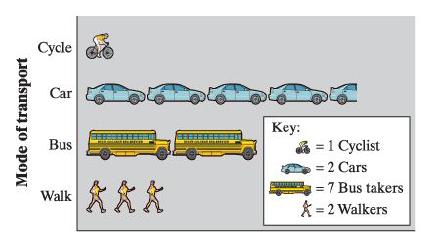
Cycle Car Key: Bus =1 Cyclist = 2 Cars | = 7 Bus takers Walk * = 2 Walkers Mode of transport
Step by Step Solution
★★★★★
3.38 Rating (160 Votes )
There are 3 Steps involved in it
1 Expert Approved Answer
Step: 1 Unlock

In the given pictograph reprentation the digrammmatical representation of one car i... View full answer
Question Has Been Solved by an Expert!
Get step-by-step solutions from verified subject matter experts
Step: 2 Unlock
Step: 3 Unlock