

Question: Getting to school Students in a high school statistics class were given data about the primary method of transportation to school for a group of
Getting to school Students in a high school statistics class were given data about the primary method of transportation to school for a group of 30 students.
Th ey produced the pictograph shown on the facing page.
(a) How is this graph misleading?
(b) Make a graph of the data that is not misleading.
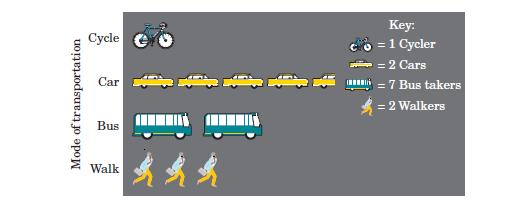
Mode of transportation Cycle Car Key: co = 1 Cycler = 2 Cars 7 Bus takers = 2 Walkers Bus Walk **
Step by Step Solution
There are 3 Steps involved in it
1 Expert Approved Answer
Step: 1 Unlock

Question Has Been Solved by an Expert!
Get step-by-step solutions from verified subject matter experts
Step: 2 Unlock
Step: 3 Unlock