

The dotplot shows the results of taking 300 SRSs of 10 temperature readings from a Normal population
Question:
The dotplot shows the results of taking 300 SRSs of 10 temperature readings from a Normal population with μ = 50 and σ = 3 and recording the sample minimum each time. Suppose that the minimum of an actual sample is 40°F. What would you conclude about the thermostat manufacturer’s claim? Explain your reasoning.
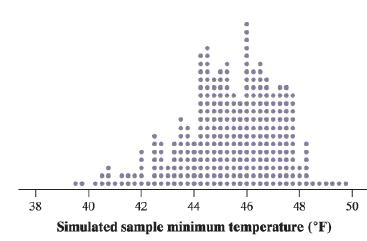
During the winter months, outside temperatures at the Starneses’ cabin in Colorado can stay well below freezing (32°F, or 0°C) for weeks at a time. To prevent the pipes from freezing, Mrs. Starnes sets the thermostat at 50°F. The manufacturer claims that the thermostat allows variation in home temperature that follows a Normal distribution with σ = 3°F. To test this claim, Mrs. Starnes programs her digital thermometer to take an SRS of n = 10 readings during a 24-hour period. Suppose the thermostat is working properly and that the actual temperatures in the cabin vary according to a Normal distribution with mean μ = 50°F and standard deviation σ = 3°F.
Step by Step Answer:
Answer Due to the fact that if the thermostat is really set at ...View the full answer


