

The following boxplots show the total income of 40 randomly chosen households each from Connecticut, Maine, and
Question:
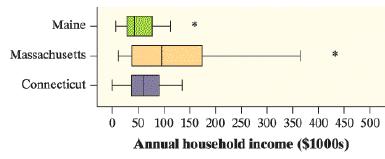
The following boxplots show the total income of 40 randomly chosen households each from Connecticut, Maine, and Massachusetts, based on U.S. Census data from the American Community Survey. Compare the distributions of annual incomes in the three states.
Fantastic news! We've Found the answer you've been seeking!
Step by Step Answer:
Box plots are based on the quartiles of the data the median shows the middle value of the data the e...View the full answer

Answered By
Marvine Ekina
Marvine Ekina
Dedicated and experienced Academic Tutor with a proven track record for helping students to improve their academic performance. Adept at evaluating students and creating learning plans based on their strengths and weaknesses. Bringing forth a devotion to education and helping others to achieve their academic and life goals.
PERSONAL INFORMATION
Address: , ,
Nationality:
Driving License:
Hobbies: reading
SKILLS
????? Problem Solving Skills
????? Predictive Modeling
????? Customer Service Skills
????? Creative Problem Solving Skills
????? Strong Analytical Skills
????? Project Management Skills
????? Multitasking Skills
????? Leadership Skills
????? Curriculum Development
????? Excellent Communication Skills
????? SAT Prep
????? Knowledge of Educational Philosophies
????? Informal and Formal Assessments
0 Reviews
10+ Question Solved
Related Book For 

Question Posted:
