

The following graph plots the gas mileage (in miles per gallon) of various cars from the same
Question:
The following graph plots the gas mileage (in miles per gallon) of various cars from the same model year versus the weight of these cars (in thousands of pounds). The points marked with red dots correspond to cars made in Japan. From this plot, we may conclude that
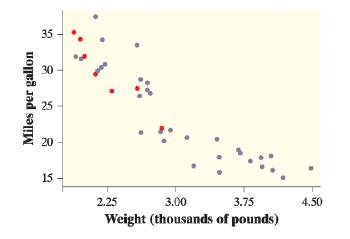
a. there is a positive association between weight and gas mileage for Japanese cars.
b. the correlation between weight and gas mileage for all the cars is close to 1.
c. there is little difference between Japanese cars and cars made in other countries.
d. Japanese cars tend to be lighter in weight than other cars.
e. Japanese cars tend to get worse gas mileage than other cars.
Select the best answer.
Fantastic news! We've Found the answer you've been seeking!
Step by Step Answer:
a There is a positive association between weight and gas mileage for Japanese cars ...View the full answer

Answered By
Ravi Tomar
I have 5 years of experience as an Agricultural Economics tutor. During this time, I have been able to successfully provide guidance to students in their studies and help them develop their knowledge and understanding of the subject. My approach to teaching has always been to combine academic learning with practical application, often drawing on my professional experience to help students better understand how the concepts they learn apply to the real world. I also focus on helping students develop critical thinking skills, enabling them to tackle problems independently and develop their own solutions. I have also been able to provide support on specific assignments, helping students to structure their work and ensure that it meets the required quality and standards.
0 Reviews
10+ Question Solved
Related Book For 

Question Posted:
