

What is the interquartile range (IQR) for the distribution of absences? a. 1 b. 2 c. 3
Question:
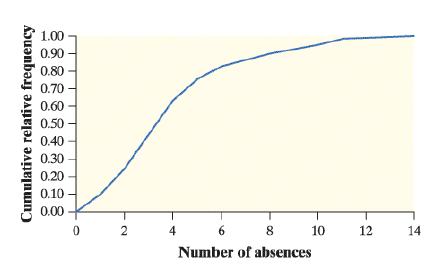
What is the interquartile range (IQR) for the distribution of absences?
a. 1
b. 2
c. 3
d. 5
e. 14
The number of absences during the fall semester was recorded for each student in a large elementary school. The distribution of absences is displayed in the following cumulative relative frequency graph.
Select the best answer.
Fantastic news! We've Found the answer you've been seeking!
Step by Step Answer:
option d is ...View the full answer

Answered By
Shikha SharmaThakur
My teaching method is primarily focused on explaining practical scenarios which helps in quick and effective understanding.
I begin with basic concepts, followed by intensive practice in tutorials and examples.
I usually prefer quick tests to know students understanding of the subject.
I design my own examples in various stages of difficulty levels to help in students understanding in addition to the text book questions
Mathematics is to solve a task with a set of rules. I provide quick notes and rules to be refereed that can be helpful to solve questions of any difficulty level
I believe learning is better if you can visualize it, and hence in addition to providing real world examples, I prefer teaching using graphs and plots for enhanced understanding of the subject
0 Reviews
10+ Question Solved
Related Book For 

Question Posted:
