

Which of the following is the best interpretation of the value 0.4117 in the computer output? a.
Question:
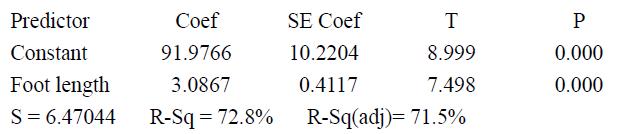
Which of the following is the best interpretation of the value 0.4117 in the computer output?
a. For each increase of 1 cm in foot length, the average height increases by about 0.4117 cm.
b. When using this model to predict height, the predictions will typically be off by about 0.4117 cm.
c. The linear relationship between foot length and height accounts for 41.17% of the variation in height.
d. The linear relationship between foot length and height is moderate and positive.
e. In repeated samples of size 25, the slope of the sample regression line for predicting height from foot length will typically vary from the population slope by about 0.4117.
To see if students with longer feet tend to be taller, a random sample of 25 students was selected from a large high school. For each student, x = foot length (cm) and y = height (cm) were recorded. We checked that the conditions for inference about the slope of the population regression line are met. Here is a portion of the computer output from a least-squares regression analysis using these data:
Step by Step Answer:


