

The graph below best represents the relationship between concentration and temperature for which of the following substances?
Question:
The graph below best represents the relationship between concentration and temperature for which of the following substances?
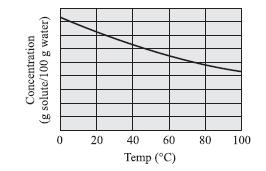
F. HCl
G. NaNO3
H. NaCl
J. KCl
Fantastic news! We've Found the answer you've been seeking!
Step by Step Answer:
The best answer is F In this question you are asked to look at the trends of the substances ...View the full answer

Answered By
Emel Khan
I have the ability to effectively communicate and demonstrate concepts to students. Through my practical application of the subject required, I am able to provide real-world examples and clarify complex ideas. This helps students to better understand and retain the information, leading to improved performance and confidence in their abilities. Additionally, my hands-on approach allows for interactive lessons and personalized instruction, catering to the individual needs and learning styles of each student.
2+ Reviews
10+ Question Solved
Related Book For 

Question Posted:
