

The table below shows the number of pounds of apples grown last year in 4 cities....
Question:
The table below shows the number of pounds of apples grown last year in 4 cities. (Each whole apple on the graph represents 1,000 pounds of apples.) According to the graph, what fraction of the apples grown in all 4 cities were grown in Appleton?
\n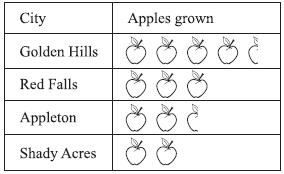
A. 5 / 24
B. 1 / 4
C. 1 / 6
D. 5 / 19
E. 3 / 16
Fantastic news! We've Found the answer you've been seeking!
Step by Step Answer:
The correct answer is A To find the fraction of apples grown in ...View the full answer

Answered By
Utsab mitra
I have the expertise to deliver these subjects to college and higher-level students. The services would involve only solving assignments, homework help, and others.
I have experience in delivering these subjects for the last 6 years on a freelancing basis in different companies around the globe. I am CMA certified and CGMA UK. I have professional experience of 18 years in the industry involved in the manufacturing company and IT implementation experience of over 12 years.
I have delivered this help to students effortlessly, which is essential to give the students a good grade in their studies.
2+ Reviews
10+ Question Solved
Related Book For 

Question Posted:
