

Question: Draw a best-fit line for the plotted data. 35: 30 25. 20 15 10- 5 0. 0 -N 2 ****** 4 6 8 *************** 10
Draw a best-fit line for the plotted data.
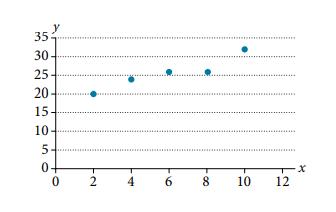
35: 30 25. 20 15 10- 5 0. 0 -N 2 ****** 4 6 8 *************** 10 12 x
Step by Step Solution
★★★★★
3.49 Rating (156 Votes )
There are 3 Steps involved in it
1 Expert Approved Answer
Step: 1 Unlock

Consider the scatter plot and table prov... View full answer
Question Has Been Solved by an Expert!
Get step-by-step solutions from verified subject matter experts
Step: 2 Unlock
Step: 3 Unlock