

Question: For the following exercises, consider the data in Table 5, which shows the percent of unemployed in a city of people 25 years or older
For the following exercises, consider the data in Table 5, which shows the percent of unemployed in a city of people 25 years or older who are college graduates is given below, by year.
Determine whether the trend appears to be linear. If so, and assuming the trend continues, find a linear regression model to predict the percent of unemployed in a given year to three decimal places.
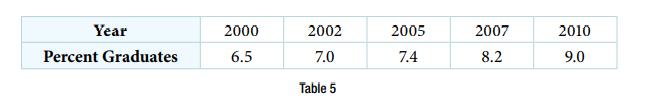
Year Percent Graduates 2000 6.5 2002 7.0 Table 5 2005 7.4 2007 8.2 2010 9.0
Step by Step Solution
3.57 Rating (168 Votes )
There are 3 Steps involved in it
for checking trend should be linear x2000 ... View full answer

Get step-by-step solutions from verified subject matter experts