

Question: For the following exercises, use Table 4 which shows the percent of unemployed persons 25 years or older who are college graduates in a particular
For the following exercises, use Table 4 which shows the percent of unemployed persons 25 years or older who are college graduates in a particular city, by year.
Determine whether the trend appears linear. If so, and assuming the trend continues, find a linear regression model to predict the percent of unemployed in a given year to three decimal places.
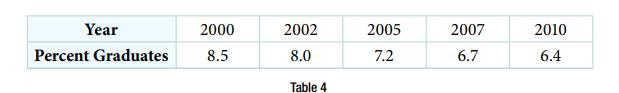
Year Percent Graduates 2000 8.5 2002 8.0 Table 4 2005 7.2 2007 6.7 2010 6.4
Step by Step Solution
3.40 Rating (169 Votes )
There are 3 Steps involved in it
From the data in Table 4 it appears that the trend of the percentage of unemployed persons 25 years ... View full answer

Get step-by-step solutions from verified subject matter experts