

Question: For the following exercises, draw a scatter plot for the data provided. Does the data appear to be linearly related? 100 250 300 450 600
For the following exercises, draw a scatter plot for the data provided. Does the data appear to be linearly related?
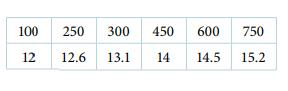
100 250 300 450 600 12 12.6 13.1 14 14.5 750 15.2
Step by Step Solution
★★★★★
3.45 Rating (168 Votes )
There are 3 Steps involved in it
1 Expert Approved Answer
Step: 1 Unlock

To draw a scatter plot of the given data in Python you can use Matpl... View full answer
Question Has Been Solved by an Expert!
Get step-by-step solutions from verified subject matter experts
Step: 2 Unlock
Step: 3 Unlock