

Question: Draw a scatter plot for the data provided in Table 3. Then determine whether the data appears to be linearly related. 02 4 6 -450-200
Draw a scatter plot for the data provided in Table 3. Then determine whether the data appears to be linearly related.
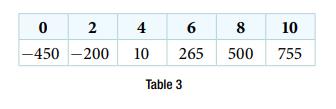
02 4 6 -450-200 10 265 Table 3 8 500 10 755
Step by Step Solution
★★★★★
3.33 Rating (162 Votes )
There are 3 Steps involved in it
1 Expert Approved Answer
Step: 1 Unlock

Consider that data shown below x 0 2 ... View full answer
Question Has Been Solved by an Expert!
Get step-by-step solutions from verified subject matter experts
Step: 2 Unlock
Step: 3 Unlock