

Question: For the following exercises, use a graphing utility to graph the given parametric equations. a. b. c. The graph of each set of parametric equations
For the following exercises, use a graphing utility to graph the given parametric equations.
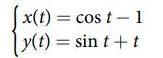
a.
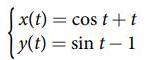
b.
c.
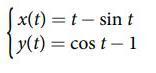
The graph of each set of parametric equations appears to “creep” along one of the axes. What controls which axis the graph creeps along?
[x(t) = cost-1 y(t) = sin t + t
Step by Step Solution
★★★★★
3.32 Rating (176 Votes )
There are 3 Steps involved in it
1 Expert Approved Answer
Step: 1 Unlock

The axis along which the graph creeps is determined by the parameter that ... View full answer
Question Has Been Solved by an Expert!
Get step-by-step solutions from verified subject matter experts
Step: 2 Unlock
Step: 3 Unlock