

Question: For the following exercises, use a graphing utility to graph the given parametric equations. a. b. c. Explain the effect on the graph of the
For the following exercises, use a graphing utility to graph the given parametric equations.
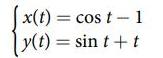
a.
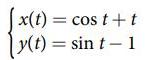
b.
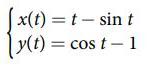
c.
Explain the effect on the graph of the parametric equation when we changed the domain.
[x(t) = cost-1 y(t) = sin t + t
Step by Step Solution
★★★★★
3.49 Rating (169 Votes )
There are 3 Steps involved in it
1 Expert Approved Answer
Step: 1 Unlock

a The parametric equations are xt cost 1 yt sint t Using a graphing utility we can plot the parametr... View full answer
Question Has Been Solved by an Expert!
Get step-by-step solutions from verified subject matter experts
Step: 2 Unlock
Step: 3 Unlock