

Question: For the following exercises, use the graph in Figure 3, showing the profit, y, in thousands of dollars, of a company in a given year,
For the following exercises, use the graph in Figure 3, showing the profit, y, in thousands of dollars, of a company in a given year, x, where x represents years since 1980.
Find and interpret the y-intercept.
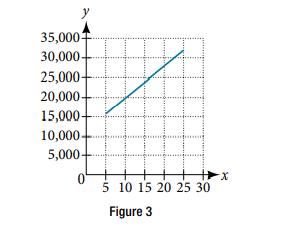
35,000 30,000- 25,000- 20,000- 15,000- 10,000- 5,000 0 5 10 15 20 25 30 Figure 3 X
Step by Step Solution
★★★★★
3.46 Rating (153 Votes )
There are 3 Steps involved in it
1 Expert Approved Answer
Step: 1 Unlock

from the graph 1020000 and 516000 ... View full answer
Question Has Been Solved by an Expert!
Get step-by-step solutions from verified subject matter experts
Step: 2 Unlock
Step: 3 Unlock