

Question: For the following exercises, use the graph in Figure 7, which shows the profit, y, in thousands of dollars, of a company in a given
For the following exercises, use the graph in Figure 7, which shows the profit, y, in thousands of dollars, of a company in a given year, t, where t represents the number of years since 1980.
Find and interpret the slope.
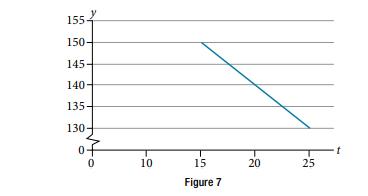
155 150- 145- 140- 135 130- 0 10 15 Figure 7 20 25 t
Step by Step Solution
★★★★★
3.46 Rating (156 Votes )
There are 3 Steps involved in it
1 Expert Approved Answer
Step: 1 Unlock

15150 and 2513... View full answer
Question Has Been Solved by an Expert!
Get step-by-step solutions from verified subject matter experts
Step: 2 Unlock
Step: 3 Unlock