

Question: Draw a scatter plot for the data in Table 2. Then determine whether the data appears to be linearly related. 0 -105 2 -50 4
Draw a scatter plot for the data in Table 2. Then determine whether the data appears to be linearly related.
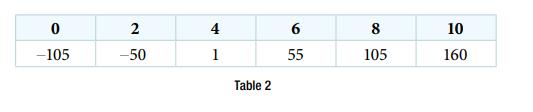
0 -105 2 -50 4 1 Table 2 65 55 8 105 10 160
Step by Step Solution
★★★★★
3.45 Rating (168 Votes )
There are 3 Steps involved in it
1 Expert Approved Answer
Step: 1 Unlock

here for checking x0 where f0105 x2 whe... View full answer
Question Has Been Solved by an Expert!
Get step-by-step solutions from verified subject matter experts
Step: 2 Unlock
Step: 3 Unlock