

Question: A meteorologist measures the atmospheric pressure P (in millibars) at altitude h (in kilometers). The data are shown below. (a) Use a graphing utility to
A meteorologist measures the atmospheric pressure P (in millibars) at altitude h (in kilometers). The data are shown below.
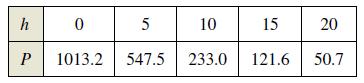
(a) Use a graphing utility to plot the points (h, ln P). Use the regression capabilities of the graphing utility to find a linear model for the revised data points.(b) The line in part (a) has the form ln P = ah + b. Write the equation in exponential form.(c) Use a graphing utility to plot the original data and graph the exponential model in part (b).(d) Find the rates of change of the pressure when h = 5 and h = 18.
h 5 10 P 1013.2 547.5 233.0 0 15 121.6 20 50.7
Step by Step Solution
3.27 Rating (162 Votes )
There are 3 Steps involved in it
a ln P 01499h 69797 ... View full answer

Get step-by-step solutions from verified subject matter experts