

The data at the top of the next column represent the atmospheric pressure p (in millibars) and
Question:
The data at the top of the next column represent the atmospheric pressure p (in millibars) and the wind speed w (in knots) measured during various tropical systems in the Atlantic Ocean.
(a) Use a graphing utility to draw a scatter plot of the data, treating atmospheric pressure as the independent variable.
(b) Use a graphing utility to find the line of best fit that models the relation between atmospheric pressure and wind speed. Express the model using function notation.
(c) Interpret the slope.
(d) Predict the wind speed of a tropical storm if the atmospheric pressure measures 990 millibars.
(e) What is the atmospheric pressure of a hurricane if the wind speed is 85 knots?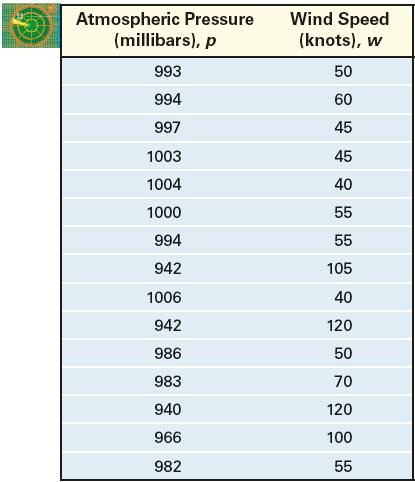
Step by Step Answer:

This question has not been answered yet.
You can Ask your question!


Precalculus Concepts Through Functions A Unit Circle Approach To Trigonometry
ISBN: 9780137945139
5th Edition
Authors: Michael Sullivan
