

An individuals income varies with age. The following table shows the median weekly income I of different
Question:
An individual’s income varies with age. The following table shows the median weekly income I of different age groups within the United States for 2021. For each age group, let the class midpoint represent the independent variable, x. For the class “65 years and older,” we will assume that the class midpoint is 69.5.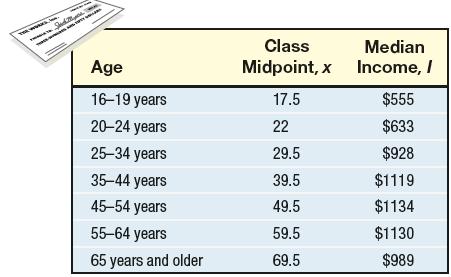
(a) Use a graphing utility to draw a scatter plot of the data. Comment on the type of relation that may exist between the two variables.(b) Use a graphing utility to find the quadratic function of best fit that models the relation between age and median income.(c) Use the function found in part (b) to determine the age at which an individual can expect to earn the most income.(d) Use the function found in part (b) to predict the peak weekly income earned.(e) With a graphing utility, graph the quadratic function of best fit on the scatter plot
Step by Step Answer:

This question has not been answered yet.
You can Ask your question!


Precalculus Concepts Through Functions A Unit Circle Approach To Trigonometry
ISBN: 9780137945139
5th Edition
Authors: Michael Sullivan
