

Economists use Lorenz curves to illustrate the distribution of income in a country. A Lorenz curve, y
Question:
Economists use Lorenz curves to illustrate the distribution of income in a country. A Lorenz curve, y = f (x), represents the actual income distribution in the country. In this model, x represents percents of families in the country from the poorest to the wealthiest and y represents percents of total income. The model y = x represents a country in which each family has the same income. The area between these two models, where 0 ≤ x ≤ 100, indicates a country’s “income inequality.” The table lists percents of income y for selected percents of families x in a country.
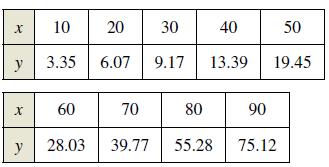
(a) Use a graphing utility to find a quadratic model for the Lorenz curve.(b) Plot the data and graph the model.(c) Graph the model y = x. How does this model compare with the model in part (a)?(d) Use the integration capabilities of a graphing utility to approximate the “income inequality.”
Step by Step Answer:
a y 00124x 2 0385x 785 b For 6 x 100 ...View the full answer


Calculus Of A Single Variable
ISBN: 9781337275361
11th Edition
Authors: Ron Larson, Bruce H. Edwards
