

Question: Graph the polynomial function f (x) = x 3 2.37x 2 4.68x + 6.93 by following Steps 1 through 8 shown bellow. Steps
Graph the polynomial function f (x) = x3 − 2.37x2 − 4.68x + 6.93 by following Steps 1 through 8 shown bellow.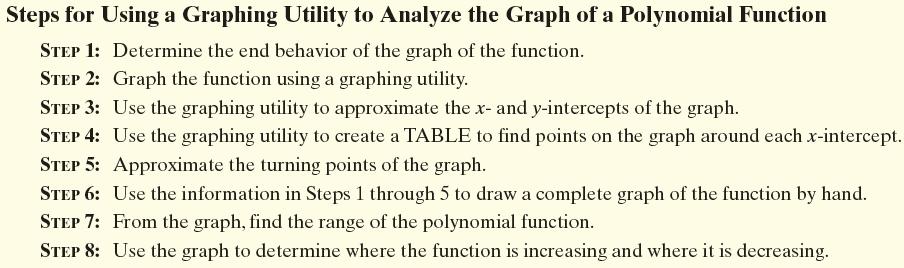
Steps for Using a Graphing Utility to Analyze the Graph of a Polynomial Function STEP 1: Determine the end behavior of the graph of the function. STEP 2: Graph the function using a graphing utility. STEP 3: Use the graphing utility to approximate the x- and y-intercepts of the graph. STEP 4: Use the graphing utility to create a TABLE to find points on the graph around each x-intercept. Approximate the turning points of the graph. STEP 5: STEP 6: Use the information in Steps 1 through 5 to draw a complete graph of the function by hand. From the graph, find the range of the polynomial function. STEP 7: STEP 8: Use the graph to determine where the function is increasing and where it is decreasing.
Step by Step Solution
3.37 Rating (156 Votes )
There are 3 Steps involved in it
To graph the polynomial function fx x3 237x2 468x 693 we can follow these steps Step 1 Determine the ... View full answer

Get step-by-step solutions from verified subject matter experts