In problem, (a) Draw a scatter diagram. (b) Select two points from the scatter diagram and find
Question:
(a) Draw a scatter diagram.
(b) Select two points from the scatter diagram and find the equation of the line containing the points selected.
(c) Graph the line found in part (b) on the scatter diagram.
(d) Use a graphing utility to find the line of best fit.
(e) Use a graphing utility to draw the scatter diagram and graph the line of best fit on it.
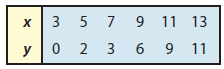
Transcribed Image Text:
3 11 13 х 5 7 9 0 2 3 6 9 11
Fantastic news! We've Found the answer you've been seeking!
Step by Step Answer:
Answer rating: 66% (6 reviews)
a b We select 5 2 and 11 9 The slope of th...View the full answer
Answered By
Rahul Kumar
Hii , I am Rahul Rajput belongs to a town from UP , india.
My academics is thought 80 plus from 10 th to gradution . I have completed Civil Engineering in year 2019 from a very repurted University Dr APJ ABDUL KALAM TECHNICAL UNIVERSITY LUCKNOW Formally known as UTTAR PRADESH TECHNICAL UNIVERSITY LUCKNOW UP. I would like to help or people by writing review on Google maps and by teachings on online tutoring apps or websites . I have previously teaching experience on " QANDA" App.
I like to walking lonely in evening. I have an also interest in listen music, world geography . I also like to aware himself and my sorroundings from world news outlets.
I try to give my best in work in which I involed present.
I hope once who interest me fall in trust with my behave .
Thanku so much
0.00
0 Reviews
10+ Question Solved
Related Book For
Question Posted:
Students also viewed these Mathematics questions
-
(a) By hand, draw a scatter diagram treating x as the explanatory variable and y as the response variable. (b) Select two points from the scatter diagram and nd the equation of the line containing...
-
(a) By hand, draw a scatter diagram treating x as the explanatory variable and y as the response variable. (b) Select two points from the scatter diagram and nd the equation of the line containing...
-
(a) By hand, draw a scatter diagram treating x as the explanatory variable and y as the response variable. (b) Select two points from the scatter diagram and nd the equation of the line containing...
-
According to a study conducted by the Gallup organization, the proportion of Americans who are afraid to y is 0.10. A random sample of 1100 Americans results in 121 indicating that they are afraid to...
-
A payoff table is given as: a. What decision should be made by the optimistic decision maker? b. What decision should be made by the pessimistic decision maker? c. What decision should be made under...
-
The Florida State League is a minor league baseball organization with teams in Bradenton, Charlotte County, Clearwater, Daytona, Dunedin, Fort Myers, Jupiter, Lakeland, Osceola County, Palm Beach,...
-
Consider the time to recharge the flash. The probability that a camera passes the test is 0.8, and the cameras perform independently. What is the probability that the third failure is obtained in...
-
At the start of 2015, the New Orleans Fine Food Company budgeted before-tax income as follows: Actual before tax income for 2015 was: Required Florence Roden, the owner of the company, is pleased...
-
Define and discuss the terms 'privacy' in the context of web analytics by drawing on an example.
-
Ross White (see Problem 6-25) wants to reconsider his decision of buying the brackets and is considering making the brackets in-house. He has determined that setup costs would be $25 in machinist...
-
In problem, graph each quadratic function using transformations (shifting, compressing, stretching, and/or reflecting). f(x) = -3(x + 2) 2 + 1
-
In problem, solve each inequality. x 2 - 9 < 0
-
Find the average rate of change for the following on the given interval. Then find the instantaneous rate of change at the first x-value. y = -2x 3 - 3x 2 + 8 from x = -2 to x = 6
-
How do you describe yourself?
-
Describe an outcome you would like to achieve.
-
Determine the order of growth of the running time of this statement in ThreeSum as a function of the number of integers \(n\) on standard input: int[] a = StdIn. readA11Ints(); Answer: Linear. The...
-
Look up Japans domestic SO 2 emissions and per capita GDP data and create a scatterplot graph. Then, explain the relationship between economic growth and SO 2 -induced environmental contamination.
-
@Tucson79 to @VW: Sunroof on wifes Bug is noisy to the point that may not get VW for next car. Mentioned this at service, still whistles constantly. Prepare a response based on the following. We cant...
-
Consider the well failure data given below. Use Bayes theorem to calculate the probability that a randomly selected well is in the gneiss group given that the well has failed. Wells Failed Geological...
-
The area of square PQRS is 100 ft2, and A, B, C, and D are the midpoints of the sides. Find the area of square ABCD. B A
-
The________ ________is the range of the middle 50% of the observations in a data set.
-
The following frequency distribution represents the birth weight of all babies born in the United States in 2017. (a) Approximate the mean and standard deviation birth weight. (b) Draw a frequency...
-
The U.S. Department of Housing and Urban Development (HUD) uses the median to report the average price of a home in the United States. Why do you think HUD uses the median?
-
Part 1 - Rent Calculation Assume the following for a floor in a multistory office building: total usable area: 62,500 sq ft; Total common area: 4,100 sq ft; total rentable area: 66,600 sq ft; Tenant...
-
14. Consider the following information on three stocks: Probability of State Rate of Return if State Occurs State of Economy of Economy Stock A Stock B Stock C Boom 0.45 0.55 0.35 0.65 Normal 0.50...
-
B2 ) Consider the following information on a portfolio of three stocks: State of Economy Probability of State of Economy Boom .15 Stock A Rate of Return .05 Stock B. Rate of Return 21 Stock C Rate of...
Study smarter with the SolutionInn App