

Question: Several research papers use a sinusoidal graph to model blood pressure. Assuming that a persons heart beats 70 times per minute, the blood pressure P
Several research papers use a sinusoidal graph to model blood pressure. Assuming that a person’s heart beats 70 times per minute, the blood pressure P of an individual after t seconds can be modeled by the function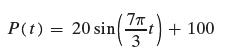
(a) In the interval [0, 1], determine the times at which the blood pressure is 100 mm Hg.
(b) In the interval [0, 1], determine the times at which the blood pressure is 120 mm Hg.
(c) In the interval [0, 1], determine the times at which the blood pressure is between 100 and 105 mm Hg.
20 sin() P(t) = 20 sin + 100
Step by Step Solution
3.45 Rating (161 Votes )
There are 3 Steps involved in it
To find the times at which the blood pressure is a specific value within the given interval we can s... View full answer

Get step-by-step solutions from verified subject matter experts