

Question: 7t + 3 Several research papers use a sinusoidal graph to model blood pressure. Suppose an individual's blood pressure is modeled by the function
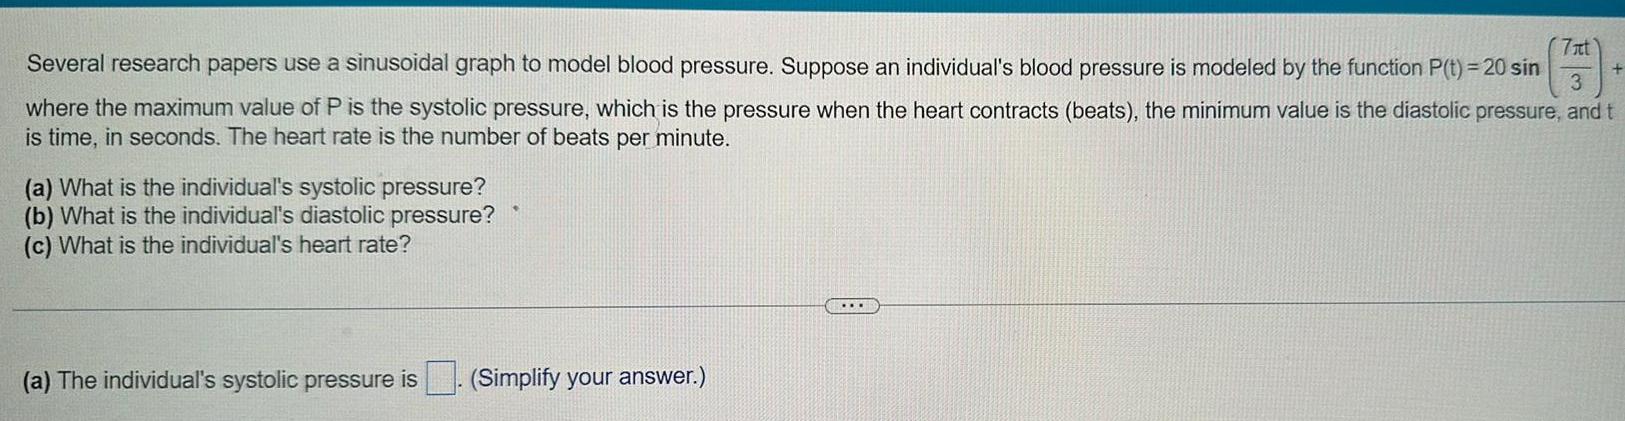
7t + 3 Several research papers use a sinusoidal graph to model blood pressure. Suppose an individual's blood pressure is modeled by the function P(t) = 20 sin where the maximum value of P is the systolic pressure, which is the pressure when the heart contracts (beats), the minimum value is the diastolic pressure, and t is time, in seconds. The heart rate is the number of beats per minute. (a) What is the individual's systolic pressure? (b) What is the individual's diastolic pressure? (c) What is the individual's heart rate? (a) The individual's systolic pressure is (Simplify your answer.)
Step by Step Solution
There are 3 Steps involved in it

Get step-by-step solutions from verified subject matter experts