

The accompanying figure shows the graph of the velocity (ft/sec) of a model rocket for the first
Question:
The accompanying figure shows the graph of the velocity (ft/sec) of a model rocket for the first 8 sec after launch. The rocket accelerated straight up for the first 2 sec and then coasted to reach its maximum height at t = 8 sec.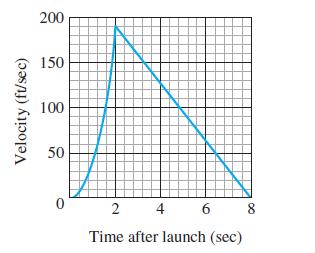
a. Assuming that the rocket was launched from ground level, about how high did it go?
b. Sketch a graph of the rocket’s height above ground as a function of time for 0 ≤ t ≤ 8.
Fantastic news! We've Found the answer you've been seeking!
Step by Step Answer:
a About 680 f...View the full answer

Answered By
Nazrin Ziad
I am a post graduate in Zoology with specialization in Entomology.I also have a Bachelor degree in Education.I posess more than 10 years of teaching as well as tutoring experience.I have done a project on histopathological analysis on alcohol treated liver of Albino Mice.
I can deal with every field under Biology from basic to advanced level.I can also guide you for your project works related to biological subjects other than tutoring.You can also seek my help for cracking competitive exams with biology as one of the subjects.
2+ Reviews
10+ Question Solved
Related Book For 
Thomas Calculus Early Transcendentals
ISBN: 9780321884077
13th Edition
Authors: Joel R Hass, Christopher E Heil, Maurice D Weir
Question Posted:
