

The accompanying graph shows the total amount of gasoline A in the gas tank of an automobile
Question:
The accompanying graph shows the total amount of gasoline A in the gas tank of an automobile after being driven for t days.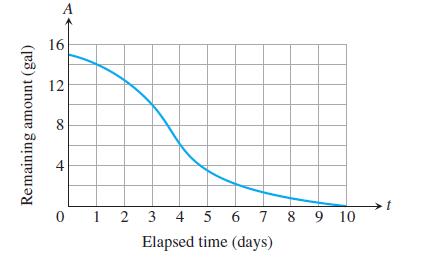
a. Estimate the average rate of gasoline consumption over the time intervals [0, 3], [0, 5], and [7, 10].
b. Estimate the instantaneous rate of gasoline consumption at the times t = 1, t = 4, and t = 8.
c. Estimate the maximum rate of gasoline consumption and the specific time at which it occurs.
Fantastic news! We've Found the answer you've been seeking!
Step by Step Answer:
a To estimate the average rate of gasoline consumption over the time intervals 0 3 0 5 and 7 10 we n...View the full answer

Answered By
Churchil Mino
I have been a tutor for 2 years and have experience working with students of all ages and abilities. I am comfortable working with students one-on-one or in small groups, and am able to adapt my teaching style to meet the needs of each individual. I am patient and supportive, and my goal is to help my students succeed.
I have a strong background in math and science, and have tutored students in these subjects at all levels, from elementary school to college. I have also helped students prepare for standardized tests such as the SAT and ACT. In addition to academic tutoring, I have also worked as a swim coach and a camp counselor, and have experience working with children with special needs.
0 Reviews
10+ Question Solved
Related Book For 
Thomas Calculus Early Transcendentals
ISBN: 9780321884077
13th Edition
Authors: Joel R Hass, Christopher E Heil, Maurice D Weir
Question Posted:
