

The data in the table below represent the percentage of patients who have survived after diagnosis of
Question:
The data in the table below represent the percentage of patients who have survived after diagnosis of advanced-stage breast cancer at 6-month intervals of time.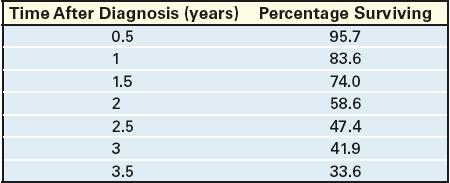
(a) Using a graphing utility, draw a scatter plot of the data with time after diagnosis as the independent variable.
(b) Using a graphing utility, build an exponential model from the data.
(c) Express the function found in part (b) in the form A(t) = A0ekt .
(d) Graph the exponential function found in part (b) or (c) on the scatter plot.
(e) Use the model to predict the percentage of patients diagnosed with advanced-stage cancer who survive for 4 years after initial diagnosis.
(f) Interpret the meaning of k in the function found in part (c).
Step by Step Answer:

This question has not been answered yet.
You can Ask your question!


Precalculus Concepts Through Functions A Unit Circle Approach To Trigonometry
ISBN: 9780137945139
5th Edition
Authors: Michael Sullivan
