

Question: The data in the table below represent annual revenue of Tesla, Inc. from 2010 to 2017. (a) Using a graphing utility, draw a scatter plot
The data in the table below represent annual revenue of Tesla, Inc. from 2010 to 2017.
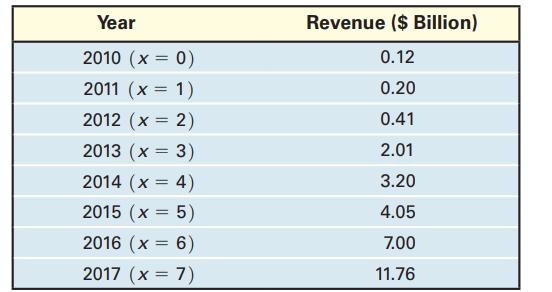
(a) Using a graphing utility, draw a scatter plot of the data using 0 for 2010, 1 for 2011, and so on, as the independent variable.
(b) Using a graphing utility, build an exponential model from the data.
(c) Express the function found in part (b) in the form A(t) = A0ekt.
(d) Graph the exponential function found in part (b) or (c) on the scatter plot.
(e) Use the exponential function from part (b) or (c) to predict Tesla’s revenue in 2019.
(f) Interpret the meaning of k in the function found in part (c).
Year 2010 (x = 0) 2011 (x = 1) 2012 (x = 2) 2013 (x = 3) 2014 (x = 4) 2015 (x = 5) 2016 (x = 6) 2017 (x = 7) Revenue ($ Billion) 0.12 0.20 0.41 2.01 3.20 4.05 7.00 11.76
Step by Step Solution
3.32 Rating (152 Votes )
There are 3 Steps involved in it
a b c d e f ... View full answer

Get step-by-step solutions from verified subject matter experts