

The figure on the left shows the graph of a function. The figure on the right shows
Question:
The figure on the left shows the graph of a function. The figure on the right shows the graph of a power series representation of the function.
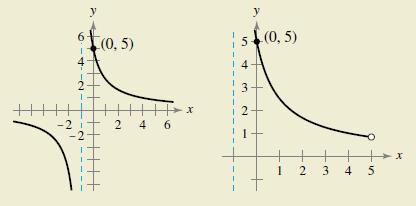
(a) Identify the function.(b) What are the center and interval of convergence of the power series?
Step by Step Answer:

This question has not been answered yet.
You can Ask your question!
Related Book For 
Calculus Of A Single Variable
ISBN: 9781337275361
11th Edition
Authors: Ron Larson, Bruce H. Edwards
Question Posted:
