

The figure shows the graphs of the functions y 1 = x, y 2 = 1/2x 3/2
Question:
The figure shows the graphs of the functions y1 = x, y2 = 1/2x3/2, y3 = 1/4x2, and y4 = 1/8 x5/2 on the interval [0, 4]. To print an enlarged copy of the graph, go to MathGraphs.com.
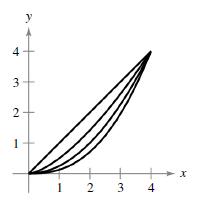
(a) Label the functions.(b) Without calculating, list the functions in order of increasing arc length.(c) Verify your answer in part (b) by using the integration capabilities of a graphing utility to approximate each arc length accurate to three decimal places.
Fantastic news! We've Found the answer you've been seeking!
Step by Step Answer:
a b y 1 y 2 y 3 y ...View the full answer

Answered By
Muhammad Rehan
Enjoy testing and can find bugs easily and help improve the product quality.
10+ Reviews
10+ Question Solved
Related Book For 
Calculus Of A Single Variable
ISBN: 9781337275361
11th Edition
Authors: Ron Larson, Bruce H. Edwards
Question Posted:
