

The following data represent the birth rate (births per 1000 population) for females whose age is a,
Question:
The following data represent the birth rate (births per 1000 population) for females whose age is a, in 2019.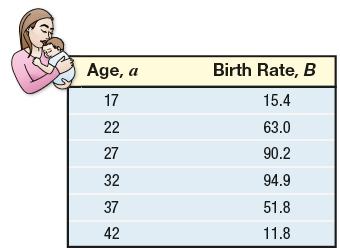
(a) Using a graphing utility, draw a scatter plot of the data, treating age as the independent variable. What type of relation appears to exist between age and birth rate?(b) Based on your response to part (a), find either a linear or a quadratic model that describes the relation between age and birth rate.(c) Use your model to predict the birth rate for 35-year-old women.
Step by Step Answer:

This question has not been answered yet.
You can Ask your question!
Related Book For 
Precalculus Concepts Through Functions A Unit Circle Approach To Trigonometry
ISBN: 9780137945139
5th Edition
Authors: Michael Sullivan
Question Posted:
