

The median price of single-family homes in the United States increased quite consistently during the years 19762000.
Question:
The median price of single-family homes in the United States increased quite consistently during the years 1976–2000. Then a housing “bubble” occurred for the years 2001–2010, in which prices first rose dramatically for 6 years and then dropped in a steep “crash” over the next 4 years, causing considerable turmoil in the U.S. economy. The table shows some of the data as reported by the National Association of Realtors.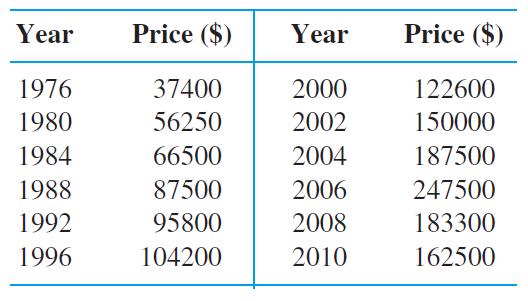
a. Make a scatterplot of the data.
b. Find and plot the regression line for the years 1976–2002, and superimpose the line on the scatterplot in part (a).
c. How would you interpret the meaning of a data point in the housing “bubble”?
Step by Step Answer:
a b y 3814x 74988 10 6 c The price of ...View the full answer


Thomas Calculus Early Transcendentals
ISBN: 9780321884077
13th Edition
Authors: Joel R Hass, Christopher E Heil, Maurice D Weir
