

The total numbers y of AIDS cases by year of diagnosis in Canada for the years 2005
Question:
The total numbers y of AIDS cases by year of diagnosis in Canada for the years 2005 through 2014 are shown in the table, with x = 5 corresponding to 2005.
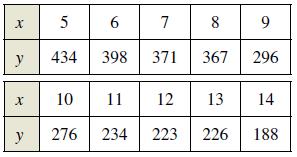
(a) Use the regression capabilities of a graphing utility to find the following models for the data.y1 = ax + by2 = a + b ln xy3 = abxy4 = axb(b) Use a graphing utility to plot the data and graph each of the models. Which model do you think best fits the data?(c) Find the rate of change of each of the models in part (a) for the year 2012. Which model is decreasing at the greatest rate in 2012?
Fantastic news! We've Found the answer you've been seeking!
Step by Step Answer:
a y 1 277x 565 y 2 843 2463 ln xy 3 70699509...View the full answer

Answered By
Susan Juma
I'm available and reachable 24/7. I have high experience in helping students with their assignments, proposals, and dissertations. Most importantly, I'm a professional accountant and I can handle all kinds of accounting and finance problems.
15+ Reviews
45+ Question Solved
Related Book For 

Calculus Of A Single Variable
ISBN: 9781337275361
11th Edition
Authors: Ron Larson, Bruce H. Edwards
Question Posted:
