

Question: Use the level curves in the figure to predict the location of the critical points of f and whether f has a saddle point or
Use the level curves in the figure to predict the location of the critical points of f and whether f has a saddle point or a local maximum or minimum at each critical point. Explain your reasoning. Then use the Second Derivatives Test to confirm your predictions.
f (x, y) = 3x - x3 - 2y3 + y4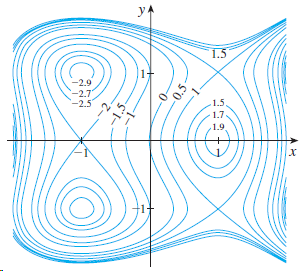
1.5 -2.9 -2.7 -2.5 1.5 1.7. 1.9 -1,5 -0.5
Step by Step Solution
★★★★★
3.56 Rating (167 Votes )
There are 3 Steps involved in it
1 Expert Approved Answer
Step: 1 Unlock

In the figure points at approximately 1 1 and 11 are enclosed by ovalshaped level curves which indic... View full answer
Question Has Been Solved by an Expert!
Get step-by-step solutions from verified subject matter experts
Step: 2 Unlock
Step: 3 Unlock