

Question: The FloridaLakes dataset, introduced in Data 2.4, includes data on 53 lakes in Florida. Two of the variables recorded are pH (acidity of the lake
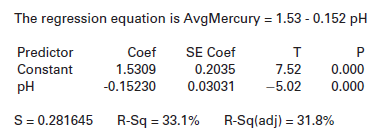
The FloridaLakes dataset, introduced in Data 2.4, includes data on 53 lakes in Florida. Two of the variables recorded are pH (acidity of the lake water) and AvgMercury (average mercury level for a sample of fish from each lake). We wish to use the pH of the lake water (which is easy to measure) to predict average mercury levels in fish, which is harder to measure. A scatterplot of the data is shown in Figure 2.49(a) on page 106 and we see that the conditions for fitting a linear model are reasonably met. Computer output for the regression analysis is shown below.
(a) Use the fitted model to predict the average mercury level in fish for a lake with a pH of 6.0.
(b) What is the slope in the model? Interpret the slope in context.
(c) What is the test statistic for a test of the slope? What is the p-value? What is the conclusion of the test, in context?
(d) Compute and interpret a 95% confidence interval for the slope.
(e) What is R2? Interpret it in context.
Data 2.4
The FloridaLakes dataset describes characteristics of water samples taken at n = 53 Florida lakes. Alkalinity (concentration of calcium carbonate in mg/L) and acidity (pH) are given for each lake. In addition, the average mercury level is recorded for a sample of fish (large mouth bass) from each lake. A standardized mercury level is obtained by adjusting the mercury averages to account for the age of the fish in each sample. Notice that the cases are the 53 lakes and that all four variables are quantitative.
The regression equation is AvgMercury = 1.53 - 0.152 pH SE Coef 0.2035 0.03031 Coef 1.5309 -0.15230 Predictor Constant 7.52 -5.02 0.000 0.000 pH S= 0.281645 R-Sq = 33.1% R-Sq(adj) = 31.8% %3!
Step by Step Solution
3.42 Rating (171 Votes )
There are 3 Steps involved in it
a For a pH reading of 60 we have The model predicts that fish in lakes with a pH of 60 will have an ... View full answer

Get step-by-step solutions from verified subject matter experts