

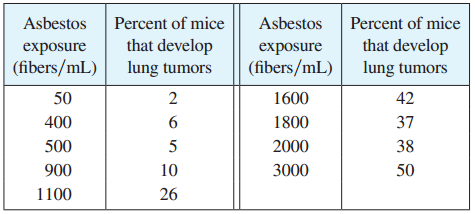
When laboratory rats are exposed to asbestos fibers, some of them develop lung tumors. The table lists
Question:
(a) Find the regression line for the data.
(b) Make a scatter plot and graph the regression line. Does the regression line appear to be a suitable model for the data?
(c) What does the y-intercept of the regression line represent?
Fantastic news! We've Found the answer you've been seeking!
Step by Step Answer:
a Using a computing device we obtain the regression line y 001...View the full answer

Answered By
Caroline Kinuthia
Taking care of the smaller details in life has a larger impact in our general well being, and that is what i believe in. My name is Carol. Writing is my passion. To me, doing a task is one thing, and delivering results from the task is another thing. I am a perfectionist who always take things seriously and deliver to the best of my knowledge.
1933+ Reviews
4269+ Question Solved
Related Book For 

Question Posted:
