

Question: 3. The predictive task in this question is to predict the level of corruption in a country based on a range of macro-economic and social
3. The predictive task in this question is to predict the level of corruption in a country based on a range of macro-economic and social features.
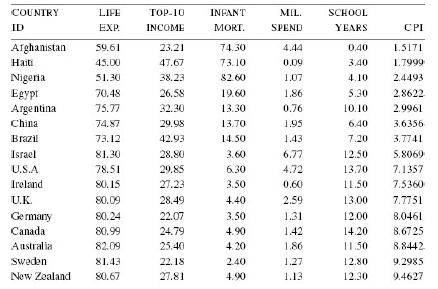
The table below lists some countries described by the following descriptive features:
LIFE EXP., the mean life expectancy at birth TOP-10 INCOME, the percentage of the annual income of the country that goes to the top 10% of earners INFANT MORT., the number of infant deaths per 1,000 births MIL. SPEND, the percentage of GDP spent on the military SCHOOL YEARS, the mean number years spent in school by adult females The target feature is the Corruption Perception Index (CPI). The CPI measures the perceived levels of corruption in the public sector of countries and ranges from 0 (highly corrupt) to 100 (very clean)
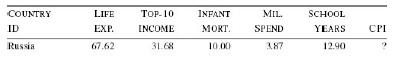
We will use Russia as our query country for this question. The table below lists the descriptive features for Russia.
a. What value would a 3-nearest neighbor prediction model using Euclidean distance return for the CPI of Russia?
b. What value would a weighted k-NN prediction model return for the CPI of Russia? Use k = 16 (i.e., the full dataset) and a weighting scheme of the reciprocal of the squared Euclidean distance between the neighbor and the query.
c. The descriptive features in this dataset are of different types. For example, some are percentages, others are measured in years, and others are measured in counts per 1,000. We should always consider normalizing our data, but it is particularly important to do this when the descriptive features are measured in different units. What value would a 3-nearest neighbor prediction model using Euclidean distance return for the CPI of Russia when the descriptive features have been normalized using range normalization?
d. What value would a weighted k-NN prediction model—with k = 16 (i.e., the full dataset) and using a weighting scheme of the reciprocal of the squared Euclidean distance between the neighbor and the query —return for the CPI of Russia when it is applied to the rangenormalized data?
e. The actual 2011 CPI for Russia was 2.4488. Which of the predictions made was the most accurate? Why do you think this was?
COUNTRY LIFE TOP-10 INFANT MIL. SCHOOL ID EXP. INCOME MORT. SPEND YEARS CPI Afghanistan 59.61 23.21 74.30 4.44 0.40 1.5171 Haiti 45.00 47.67 73.10 0.09 3.40 1.7999 Nigeria 51.30 38.23 82.60 1.07 4.10 2.4493 Egypt 70.48 26.58 19.60 1.86 5.30 2.8622 Argentina 75.77 32.30 13.30 0.76 10.10 2.9961 China 74.87 29.98 13.70 1.95 6.40 3.6356 Brazil 73.12 42.93 14.50 1.43 7.20 3.7741 Israel 81.30 28.80 3.60 6.77 12.50 5.8069 U.S.A 78.51 29.85 6.30 4.72 13.70 7.1357 Ireland 80.15 27.23 3.50 0.60 11.50 7.5360 U.K. 80.09 28.49 4.40 2.59 13.00 7.7751 Germany 80.24 22.07 3.50 1.31 12.00 8.0461 Canada 80.99 24.79 4.90 1.42 14.20 8.6725 Australia 82.09 25.40 4.20 1.86 11.50 8.8442 Sweden 81.43 22.18 2.40 1.27 12.80 9.2985 New Zealand 80.67 27.81 4.90 1.13 12.30 9.4627
Step by Step Solution
There are 3 Steps involved in it

Get step-by-step solutions from verified subject matter experts