

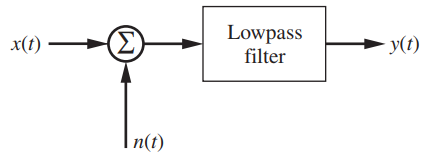
Question: Consider the system shown in Figure 8.24. The noise is white with two-sided power spectral density 1/2 N 0 . The power spectral density of
Consider the system shown in Figure 8.24. The noise is white with two-sided power spectral density 1/2 N0. The power spectral density of the signal is
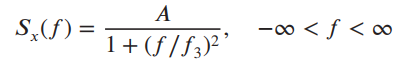
The parameter f3 is the 3-dB bandwidth of the signal. The bandwidth of the ideal low pass filter is W. Determine the SNR of y(t). Plot the SNR as a function of W / f3.
Figure 8.24
-o < f < o S(f) = 1+(f/f3) Lowpass filter y(t) x(t) n(t)
Step by Step Solution
★★★★★
3.61 Rating (165 Votes )
There are 3 Steps involved in it
1 Expert Approved Answer
Step: 1 Unlock

The signal power is Since N D N 0 W the sign... View full answer
Question Has Been Solved by an Expert!
Get step-by-step solutions from verified subject matter experts
Step: 2 Unlock
Step: 3 Unlock