

Question: A soil profile is shown in Figure P3.3 along with the standard penetration numbers in the clay layer. Use Eqs. (3.8b) and (3.9) to determine
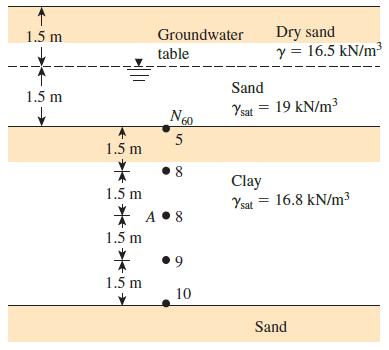
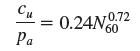
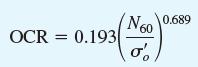
A soil profile is shown in Figure P3.3 along with the standard penetration numbers in the clay layer. Use Eqs. (3.8b) and (3.9) to determine the variation of cu and OCR with depth. What is the average value of cu and OCR?
Figure P3.3
Eqs. (3.8b)
Eqs. (3.9)
Dry sand y = 16.5 kN/m3 1.5 m Groundwater table Sand 1.5 m Ysat = 19 kN/m3 Ngo 60 5 1.5 m 8 Clay Ysat = 16.8 kN/m 1.5 m * A 8 1.5 m 1.5 m 10 Sand
Step by Step Solution
★★★★★
3.56 Rating (160 Votes )
There are 3 Steps involved in it
1 Expert Approved Answer
Step: 1 Unlock

Question Has Been Solved by an Expert!
Get step-by-step solutions from verified subject matter experts
Step: 2 Unlock
Step: 3 Unlock