

Question: 1 2 . 3 A soil profile is shown in Figure 1 2 . 3 0 along with the standard penetration numbers in the clay
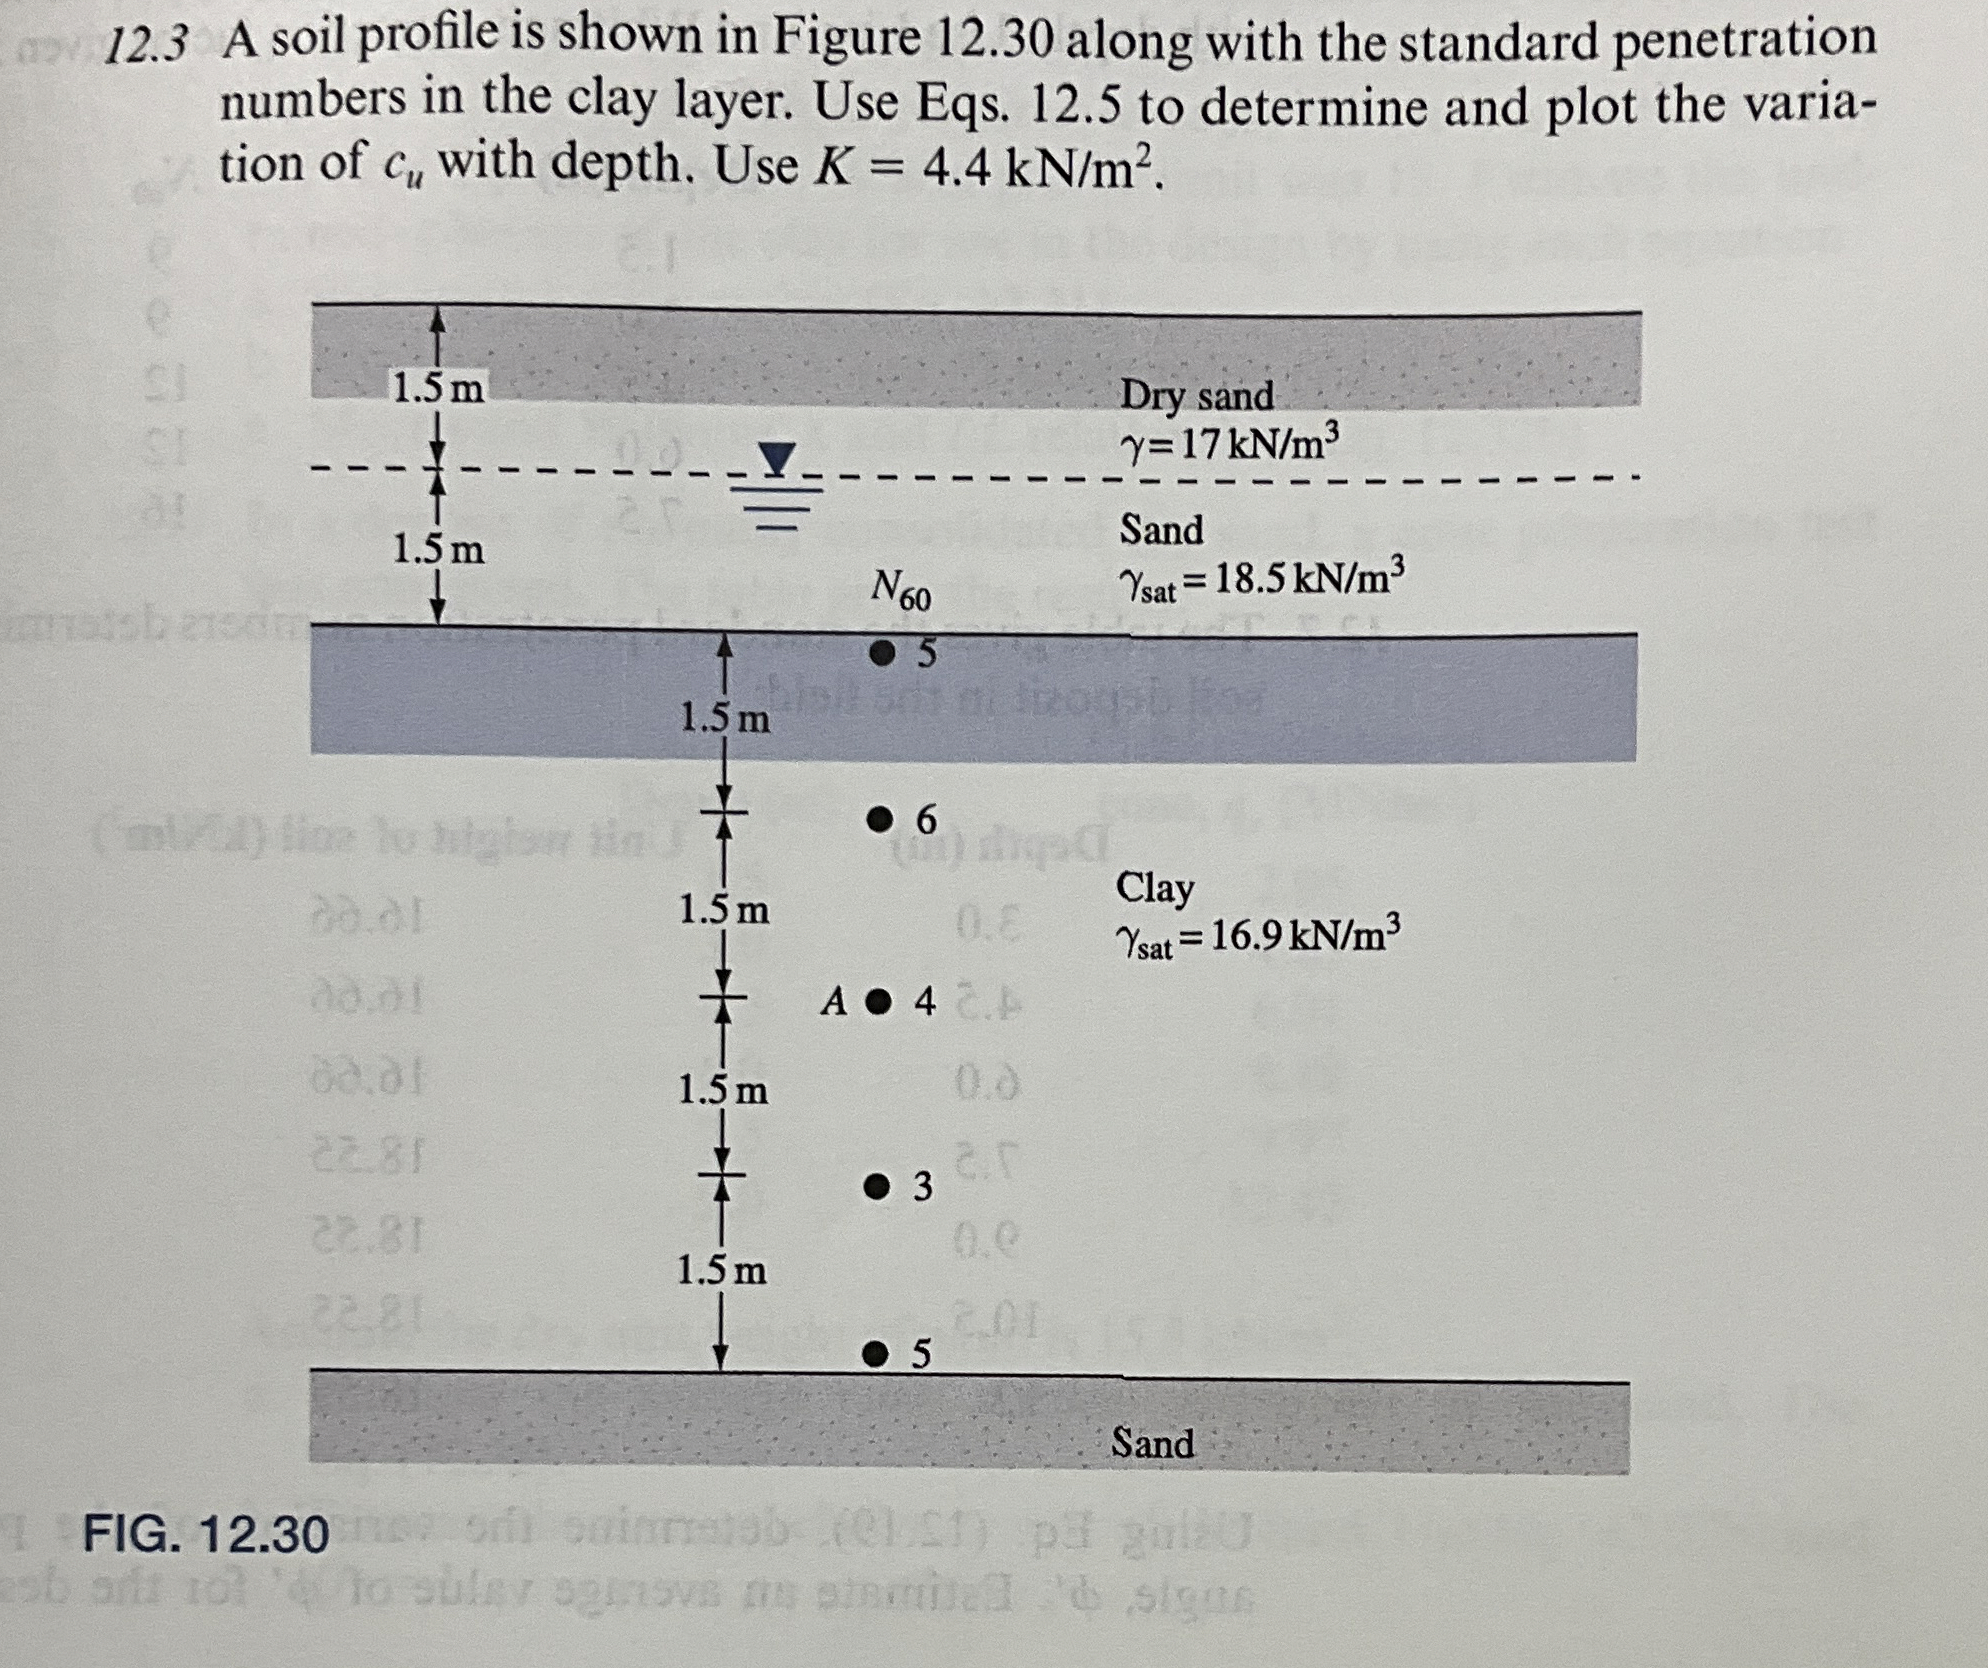
A soil profile is shown in Figure along with the standard penetration numbers in the clay layer. Use Eqs. to determine and plot the variation of with depth. Use
FIG.
Step by Step Solution
There are 3 Steps involved in it
1 Expert Approved Answer
Step: 1 Unlock

Question Has Been Solved by an Expert!
Get step-by-step solutions from verified subject matter experts
Step: 2 Unlock
Step: 3 Unlock